

Abstract
Poor air quality is directly related to climate change mitigation policies and human activities. The Coupled Model Intercomparison Project Phase 6 (CMIP6) presents an opportunity to analyze the projected concentrations of many air pollutants. A key component of CMIP6 is the use of socio-economic pathways (SSPs) to highlight the impact of regional and global climate change policies on the concentrations of air pollutants.
In this study I conduct an evaluation of several CMIP6 models for the concentrations of methane (CH₄), carbon monoxide (CO), and nitrogen dioxide (NO₂) from 2015 to 2100. I use the outputs from three different SSP scenarios: SSP126, SSP245, and SSP585 to represent a wide spread of possible policy implementations. Concentrations of these pollutants are expected to rise in each scenario, and it is expected to see significantly higher increases in the SSP245 andSSP585 scenarios due to less rigid climate change regulations. The environmental and human health impacts from a rise in concentrations of CH₄, CO, and NO₂ is further discussed. The study area is the contiguous United States (CONUS).
Introduction
The Coupled Model Intercomparison Project Phase 6 (CMIP6) provides an opportunity to study changes in air pollutant concentrations using the most up-to-date climate and Earth system models. In comparison to its predecessor CMIP5 (Coupled Model Intercomparison Project Phase 5), CMIP6 incorporates new representation of atmospheric and aerosol chemistry, with different models varying in how they simulate chemistry interaction between air pollutants, future natural precursor emissions, and future climate settings for temperature and precipitation (Turnock et al., 2020).
CMIP5 is also improved upon by CMIP6 with the inclusion of different future projections based on socio-economic factors. The Representative Concentration Pathways (RCPs) used in CMIP5 did a good job of illustrating levels of climate forcing, but they did not integrate specific socio-economic narratives (Rao et al., 2016). To improve upon this, CMIP6 includes shared socio-economic pathways (SSPs) that integrate social, economic, and environmental development trends (Turnock et al., 2020). CMIP6 combines the use of RCPs and SSPs, and the SSP scenarios include several radiative forcing targets that vary by implementations of local and global policies (Gidden et al., 2019).
The SSPs in the CMIP6 models range from maximum air pollution mitigation policies that result in less than 2°C (1.9 Wm-2 scenario) to minimum policies that result in an increase of 5°C (8.5 Wm-2 scenario) for end of century temperatures (Gidden et al., 2019). The SSPs are scenarios for future air pollution that use a context of climate change adaption and mitigation. The textual description of climate change adaption and mitigation includes a wide range of socio-economic influencers on concentrations of air pollutants, such as trends in lifestyle, policy, technology, institutions, and demographics (Rao et al., 2016). There are five primary scenarios in the SSPs (SSP1-5). SSP1 and SSP5 compare the growth of sustainable and fossil fuel energies in the future, and SSP3 and SSP4 evaluate the high inequality among countries globally and even regionally within countries (Gidden et al., 2019). SSP2 depicts a middle-of-the-road, or business-as-usual, pathway that operates in a world that continues to follow modern-day trends with no major policy or industry changes for air pollutant emissions (Rao et al., 2016).
Many accidental and intentional anthropogenic activities are processes that release gases and aerosols into the atmosphere. Anthropogenic emissions are defined as emissions that directly arise from human activities. This covers a wide range of human interests, such as agricultural and industrial sectors, building and roadway construction, transportation, energy production and transformation, and human-caused forest fires (Feng et al., 2020). Natural wildfires also release large amounts of detrimental air pollutants into the atmosphere (Knorr et al., 2016). Air pollutants have many relevant effects, such as influencing Earth’s radiative balance, diminishing human quality of life and exacerbating human health conditions, injuring ecosystems (Turnock et al., 2020), damaging buildings and monuments (Rao et al., 2016), interfering with food safety, accelerating animal extinctions (Manisalidis et al., 2020), altering Earth’s atmospheric composition, and impacting deposition rates (Feng et al., 2020).
In small quantities, air toxins are not concentrated enough to be considered pollutants. Air pollutants are substances that are produced in the environment in higher than usual ambient concentrations and have been shown to cause damage to living organisms and the environment (Manisalidis et al., 2020). Air pollutants can produce numerous health issues for humans such as asthma, bronchiolitis, chronic obstructive pulmonary disease (COPD), lung cancer, central nervous system dysfunctions, diabetes, cutaneous diseases, cardiovascular problems, and infant and adult mortality (Manisalidis et al., 2020). Particulate matter with a diameter equal to or less than 2.5 μm (PM2.5), surface ozone (O₃), carbon monoxide (CO), methane (CH₄), ammonia (NH₃), nitrogen oxides (NOx), sulfur dioxide (SO₂), volatile organic compounds (VOCs), and other are pollutants are considered harmful to humans. The degree of harm is based on the concentration of the pollutant and the length a human is exposed to the pollutant.
Industrial activities and fossil fuel consumption have significantly increased over the 19th and 20th centuries, and emissions from these sources have also increased (Feng et al., 2020; Turnock et al., 2020). This has led to larger concentrations of surface ozone, aerosols, and other air pollutants (Feng et al., 2020). Exposure to current atmospheric levels of surface ozone and PM2.5 have caused about 4 million premature deaths per year (Turnock et al., 2020). Crops and vegetation have also shown signs of damage due to air pollutants. The industrial revolution was accompanied by an increase in air pollutant emissions, but it also produced new technology, created new conduits for society, and introduced new types of services (Manisalidis, et al., 2020). Some of these have increased human quality of life, but the air pollutant emissions have worked to counteract some of these benefits by causing environmental damage, human diseases, and human death. Poor air quality also impacts human quality of life in less deadly, but still very inconvenient, ways. For example, airplane flights are frequently delayed or cancelled in regions with high levels of air pollution, such as New Delhi, India (Manisalidis et al., 2020).
The source of air pollutant emissions is largely concentrated in East and South Asia due to rapid industrialization and a surging population growth in recent years (Feng et al., 2020). Air pollution controls over the past few decades in North America and Europe have removed large sources of air pollutant emissions in these regions, which explains the shift from copious emissions in North America and Europe to the regions of East and South Asia. Intrinsically, air pollution is very sensitive to meteorology since variables such as wind speed and direction, temperature, relative humidity, precipitation, clouds, and mixing heights effect air pollutant formation and removal rates (Nolte et al., 2018). Climate change will impact each of these meteorological variables, tightly linking air pollution concentrations with the climate. Infectious diseases and outbreaks will be affected in their intensity, timing, and duration in response to climate change (Manisalidis et al., 2020). Warming climates shift ecosystem regions to higher latitudes, extending the spatial range for species that vary parasitic or viral diseases, such as mosquitos. Warming climates also shorten pathogen incubation periods (Manisalidis et al., 2020).
Regional and global emission control measures are very important for producing reductions in future air pollution in the atmosphere. Species interactions and lifetimes must also be considered, though, when creating control measures (Turnock et al., 2020). For example, local reductions in emissions for surface ozone, which has a relatively short lifespan of approximately 2 weeks, can be effectively negated by an increase in global emissions of methane, which has a much longer lifespan of about a decade in the atmosphere. CMIP6 data can provide very helpful insights, but contextual understanding of local and global regions and species interaction is necessary for utilizing the information from the CMIP6 models.
CMIP6 allows for a greater range of future air pollutants to be assessed than CMIP5 due to emission mitigation and social and economic developments being incorporated into target future climate and air quality values in the models. However, there is still large regional variability between SSPs that is reflected by potential regional policies and mitigation efforts for both climate and air quality (Turnock et al., 2020). There are still uncertainties and variables in air pollutant policies in the SSPs, such as region-specific success in reaching future air pollution goals with active time restraints, level of stringency of policies, and the used enforcement methods (Rao et al., 2016).
There are significant environmental and health effects associated with CH₄, CO, and NO₂. CH₄ is a greenhouse gas (GHG) that absorbs thermal-IR radiation 25 times more efficiently than CO₂. Methane also has a long atmospheric lifetime that ranges from 8-12 years, which is important for global transportation. Methane’s long lifetime against chemical breakdown enhances surface ozone formation in photochemical smog and contributes to global surface ozone. CH₄ has no direct harmful human effects at typical outdoor or indoor mixing ratios, but high levels of exposure in humans can reduce the amount of oxygen breathed in from the air.
CO is a minor GHG that absorbs some thermal-IR radiation. It is also an important component of urban and indoor air pollution and plays a role in urban ozone formation. Exposure at 300 ppmv for one hour causes a headache, but exposure at 700 ppmv for an hour causes death. CO dissolves in blood and replaces oxygen as an attachment to hemoglobin, causing hypoxia. Even after treatment, high levels of CO exposure can cause neurological or psychological symptoms.
NO₂ is a precursor of nitric acid, which is a component of acid deposition, and it an intermediary between the emission of NO and the formation of O₃. Low levels of NO₂ can cause sore throats, colds, and reduce lung capacity by 10%. It may also trigger asthma by damaging or irritating lungs. High levels of exposure to NO₂ result in acute bronchitis and eventually death.
Air pollution occurs on local, regional, and global scales. Understanding historical emissions and future projections from CMIP6 models, as well as the local socio-economic factors, will immensely aid in assessing air pollution control policies and management practices. The literature review showed significant research on the impacts of surface ozone and PM2.5 and how these air pollutants correspond with observations. There needs to be more study on how other air pollutants, such as methane (CH₄), carbon monoxide (CO), and nitrogen dioxide (NO₂) predictions from CMIP6 align with observations.
Methods
CMIP6 air pollutants and simulations
Air pollution occurs on local, regional, and global scales. Understanding historical emissions and future projections from CMIP6 models, as well as the local socio-economic factors, will immensely aid in assessing air pollution control policies and management practices. The literature review showed significant research on the impacts of surface ozone and PM2.5 and how these air pollutants correspond with observations. There needs to be more study on how other air pollutants, such as methane (CH₄), carbon monoxide (CO), and nitrogen dioxide (NO₂) predictions from CMIP6 align with observations.
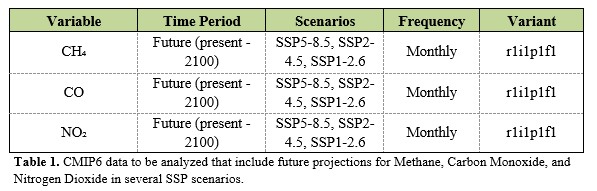
The r1i1p1f1 variant was chosen as the base analysis for the concentrations of CH₄, CO, and NO₂. This variant indicates that the realization (ensemble member), initialization method, perturbation (physics), and forcing are level 1 across all four of the ensemble axis. The ensemble axis value for each was taken from a prior simulation and no random initial perturbation was added. Using only one variant across several models instead of numerous variants provides a clearer comparison of future projections for CH₄, CO, and NO₂.
The historical values for CH₄, CO, and NO₂ were obtained for the time period of 1950 – 2015 to use as reference values for the future projections of each pollutant. The future projections run from 2015 – 2100.
Computational scripts
The files for CH₄, CO, and NO₂ contained pollutant concentrations over time, height in the atmosphere, latitude, and longitude. I chose to evaluate the concentrations at the surface level of the atmosphere and for the regional area of the contiguous United States. I calculated a domain average across the CONUS latitudes and longitudes for each time step between 2015 – 2100 for each SSP for each pollutant. I then calculated the domain average for the historical values for each pollutant. The values for CH₄ were converted into ppbv, and the values for CO and NO₂ were converted into teragrams (Tg) based on figures from the literature review.
After the domain averages were calculated, I created several time series plots. I decided to use one main plot for each pollutant, and the future projections from each SSP are shown along with the historical reference points from 2015 and 1950 values. All of the calculations were completed using Python scripts I developed.
Regional and global policies
I conducted an analysis of the impacts of regional and global policies on the projections of CH₄, CO, and NO₂ based on a review completed by Riahi et al. (2017). There are five primary scenarios in the SSPs (SSP1-5). SSP1 and SSP5 compare the growth of sustainable and fossil fuel energies in the future. SSP1 envisions a sustainable future that focuses on environmental boundaries and perceives resources in the context of global commons. Regional policies positively influence education and health for general citizens, and economies around the globe shift from being economic growth-centered to human quality of life-centered. There is a strong push for lower consumption of materials and lower energy usage. SSP5 favors the further development of fossil fuels. Sustainability is still a goal in SSP5, but the means to achieve this are focused on increasing global markets, human and social capital, and the rates of technological progress. There is still a push for enhancing education and health care. These achievements are a result from severe environmental exploitation to obtain fossil fuels and material resources. The general lifestyle includes high resource and high energy usage.
SSP3 and SSP4 evaluate the high inequality among countries globally and even regionally within countries. The world in SSP3 includes a significant amount of regional rivalry. There is low collaboration between countries, and policies shift to accommodate concerns about national security, competitiveness between countries, and achieving domestic food, energy, and resource security at the cost of other countries’ survival. This focus on policies causes investment into education, health care, and economic progress to drop, producing a higher rate of inequality, consumption of resources, and loss of environmental habitats. SSP4 is similar to SSP3, but it extrapolates on greater inequality within and among countries. In SSP4 the gap between the upper and lower class widens with almost no middle class in between. There is high investment in human capital, technology, education, health care, and mitigation for environmental issues from the high use of fossil fuels, but these investments only occur for upper class citizens in developed countries. The lower class citizens and populations of less developed countries experience low rates of education, poor health care and living conditions, low access to energy and materials, work labor-intensive jobs, and reside in environments degraded by the use of richer countries. Since my study focuses on SSP1, SSP2, and SSP5, a future study would include the impacts of SSP3 and SSP4 on the United States.
SSP2 depicts a middle-of-the-road, or business-as-usual, pathway that operates in a world that continues to follow historical and modern-day trends in technology, economics, and the social distribution with no major policy or industry changes for air pollutant emissions. Countries that are pushing for social, economic, and environmental change today see some of those efforts pay off. Countries that are not able to invoke change struggle to keep up and continue to experience a lower quality of life with limited access to resources. National institutions work for positive change, but progress is slow and uneven. The global average energy and resource use decreases slightly, but there is still noticeable inequality and environmental exploitation between countries.
In the future projections of CMIP6, Gross Domestic Product (GDP) is highest for SSP5 and SSP1, and it is lowest for SSP3 and SSP4. GDP per capita follows the same trend. Population is highest for SSP3. SSP4 and SSP2 are in the middle and are about the same for population, and SSP5 and SSP1 show the lowest populations. Urbanization is highest for SSP5, SSP1, and SSP4. Urbanization is the lowest for SSP3.
Results
As urbanization and population globally increases from the present to 2100, it is expected that the concentrations for CH₄, CO, and NO₂ will all increase. However, under the SSP126 scenario, the increase is expected to be minimal, or there may even be a slight decrease globally for each pollutant. This is due to stringent climate change policies and remediation efforts. Under the SSP585 scenario, which involves strong fossil fuel development, the concentrations of CH₄, CO, and NO₂ are expected to increase substantially. Under the business-as-usual SSP245 scenario, the concentrations of CH₄, CO, and NO₂ are expected to rise significantly, though not to levels seen in SSP585. There is likely to be a brief increase for each concentration initially before certain SSPs begin to taper off or continue to rise. All projections are expected to differ slightly from the RCP scenarios previously used. My study found these expectations to be mostly accurate.
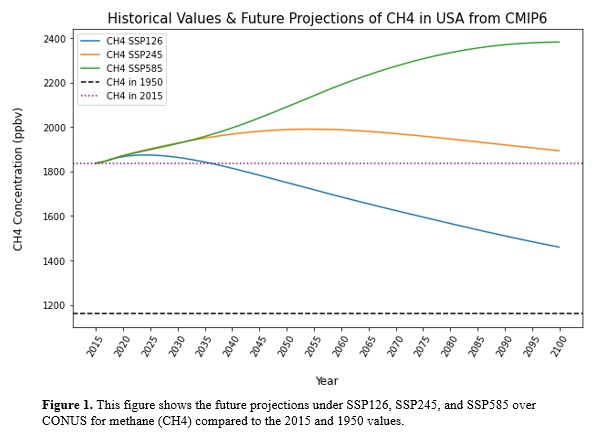
Looking at Figure 1 we can see that the only SSP in which the concentrations of CH₄ return to or go below the 2015 concentration level of methane is SSP126. Under SSP126, CH₄ concentrations return to 2015 values around the year 2035. Methane concentrations approach the 2015 levels under SSP245 near the year 2100, but it is not yet certain when methane concentrations would actually reach the 2015 levels. None of the scenarios ever returned to 1950 levels of methane.

Figure 2 shows the future projections of CO, and we can see a similar trend to CH₄ where SSP126 is the main scenario in which CO concentrations eventually return to 2015 concentration levels of CO. There is a sharp dip in all three SSPs around 2016, but then each follows the projected pattern. Although SSP245 indicates a downward trend by 2100, SSP585 is still increasing, showing the impact of high fossil fuel development in projections for SSP585. The concentrations of CO reach 2015 levels in the year 2075, and no scenarios show a return to 1950 levels of carbon monoxide by 2100.
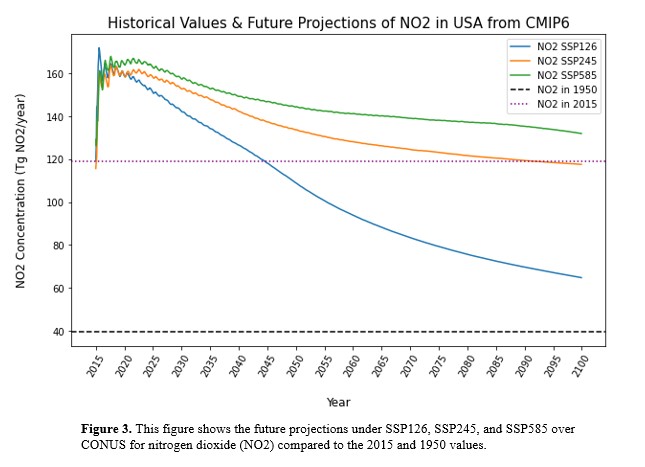
The future projections of nitrogen dioxide show a return to 2015 levels in both SSP126 and in SSP245, which occur in the years 2044 and 2087, respectively. There is also a sharp dip in 2016 where NO₂ concentrations under SSP245 and SSP585 reach or go under 2015 levels, but this is a temporary drop that quickly returns to projected patterns. None of the scenarios for nitrogen dioxide return to 1950 levels by the year 2100.
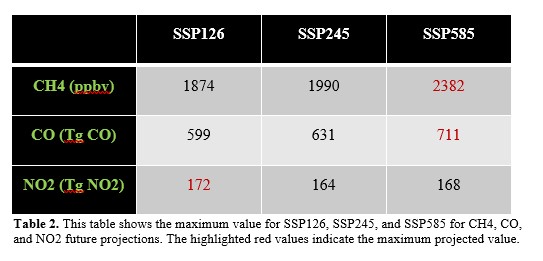
I calculated the peak value for the domain average of CH₄, CO, and NO₂ for the scenarios in SSP126, SSP245, and SSP585. The expected outcome is that the maximum concentration would occur in SSP585 due to the high use of fossil fuels for development. This trend is seen for methane and carbon monoxide. However, for nitrogen dioxide the peak value actually occurs in SSP126. This peak can also be seen in Figure 3 between the years 2016 and 2017. After this peak, there is a sharp decline in NO₂ values that follow the projected values for the SSP126 scenario where emissions are tightly controlled. The cause for this peak is currently unknown but would be addressed in future studies.
Depending on the concentration of CH₄, CO, and NO₂, there will be some degree of impact on air quality, climate change, and human health and quality of life. Climate change is influenced by an increase in GHGs, so the increases in CH₄ and CO will contribute to this as well as the modification of Earth’s radiative forcing. Air quality, human health, and human quality of life will be impacted by all three pollutants. An increase in CH₄ and NO₂ would also result in an increase in surface O₃ since both CH₄ and NO₂ are precursors of ozone.
The five main SSPs range from SSP1 to SSP5. SSP1 and SSP5 include strong policies, although SSP5 depends on prominent fossil fuel developments. SSP2 follows policies along a middle-of-the-road scenario. SSP3 and SSP4 include less effective policies and regulatory behaviors due to strong inequality between and within countries. This study utilized the socio-economic narratives from SSP1, SSP2, and SSP5 to represent a broad range of possible policy implementations. Although the concentrations of CH₄, CO, and NO₂ were analyzed for just the CONUS region, the policies of other regional areas are significant in understanding USA and global future projections of air quality. Some pollutants, like methane, have long lifetimes in the atmosphere, making global dispersion readily obtainable. The interaction of species and pollutant lifetimes in light of regional and global policy would be analyzed in future studies.
Conclusions
Anthropogenic air pollution is a major concern in the modern world. Outdoor air pollution is responsible for approximately 4 million pre-mature deaths each year, and it can impair human health and reduce human quality of life. Air pollution also impacts the functionality of the environment and significantly contributes to climate change. The models from CMIP6 offer an opportunity to study the concentrations of various air pollutants using the most up-to-date chemistry interactions, pollutant behavior, seasonality of emissions, and future projections. CMIP6 integrates a socio-economic narrative that incorporates a wide spread of climate policy and mitigation efforts. These SSPs help to understand the impact of regional and global climate change policies on the future concentrations of air pollutants.
The influence of surface ozone and PM2.5 have been thoroughly analyzed in previous studies, but more analysis was needed on the impact of methane, carbon monoxide, and nitrogen dioxide concentrations in future projections. The concentrations of CH₄, CO, and NO₂ were analyzed and are expected to increase from the present to 2100. The exact measure of increase becomes more significant under SSP245 and SSP585. An analysis of regional and global climate change policies using the SSP assumptions combined with pollutant species lifetimes and interactions provides additional insights into future projections of air pollution. This analysis also further outlines the impact of policymakers implementing appropriate mitigation and policies to reduce harmful effects of climate change and air pollution regionally and globally. Further research and understanding of both climate change policies and the impacts of CH₄, CO, and NO₂ on the environment and human health are necessary to improve the robustness of global future projections of air pollutants.
Want to know more?
- Feng, L., Smith, S. J., Braun, C., Crippa, M., Gidden, M. J., & Hoesly, R. (2020). The generation of gridded emissions data for CMIP6, 461–482.
- Gidden, M. J., Riahi, K., Smith, S. J., Fujimori, S., Luderer, G., Kriegler, E., … Takahashi, K. (2019). Global emissions pathways under different socioeconomic scenarios for use in CMIP6 : a dataset of harmonized emissions trajectories through the end of the century, 1443–1475.
- Knorr, W., Jiang, L., & Arneth, A. (2016). Climate , CO 2 and human population impacts on global, 267–282. https://doi.org/10.5194/bg-13-267-2016
- Manisalidis, I., Stavropoulou, E., & Stavropoulos, A. (2020). Environmental and Health Impacts of Air Pollution : A Review, 8(February), 1–13. https://doi.org/10.3389/fpubh.2020.00014
- Nolte, C. G., Spero, T. L., Bowden, J. H., Mallard, M. S., & Dolwick, P. D. (2018). The potential effects of climate change on air quality across the conterminous US at 2030 under three Representative Concentration Pathways, 15471–15489.
- Rao, S., Klimont, Z., Smith, S. J., Dingenen, R. Van, Dentener, F., Bouwman, L., … Tavoni, M. (2016). Future air pollution in the Shared Socio-economic Pathways, 42, 346–358. https://doi.org/10.1016/j.gloenvcha.2016.05.012
- Riahi, K., Vuuren, D. P. Van, Kriegler, E., Edmonds, J., Neill, B. C. O., Fujimori, S., … Tavoni, M. (2017). The Shared Socioeconomic Pathways and their energy, land use, and greenhouse gas emissions implications : An overview, 42, 153–168. https://doi.org/10.1016/j.gloenvcha.2016.05.009
- Turnock, S. T., Allen, R. J., Andrews, M., Bauer, S. E., Emmons, L., Horowitz, L., … Tilmes, S. (2020). Historical and future changes in air pollutants from CMIP6 models, (January), 1–40.
