

Goodreads is a well-known website containing information about and reviews for thousands of books from around the world. Additionally, Goodreads provides an application programming interface, or API, that makes a vast amount of this data publicly available. This feature makes Goodreads an important source of data for looking into various types of books
and authors.
I decided to use this information from Goodreads to examine what factors are most influential for an author’s average rating in the United States. In order to accomplish this, I used a multiple regression to isolate each coefficient’s association with the author’s average rating. All of the work you will see was completed in R.
Some of the findings align with my initial assumptions, but others were more surprising, such as the relationship between average rating and the number of ratings and number of reviews. Overall, the most significant influencers on an author’s average rating in the United States are the gender, number of individual works published by an author, and the number of reviews.
Getting Started (Aka Cleaning the Data)
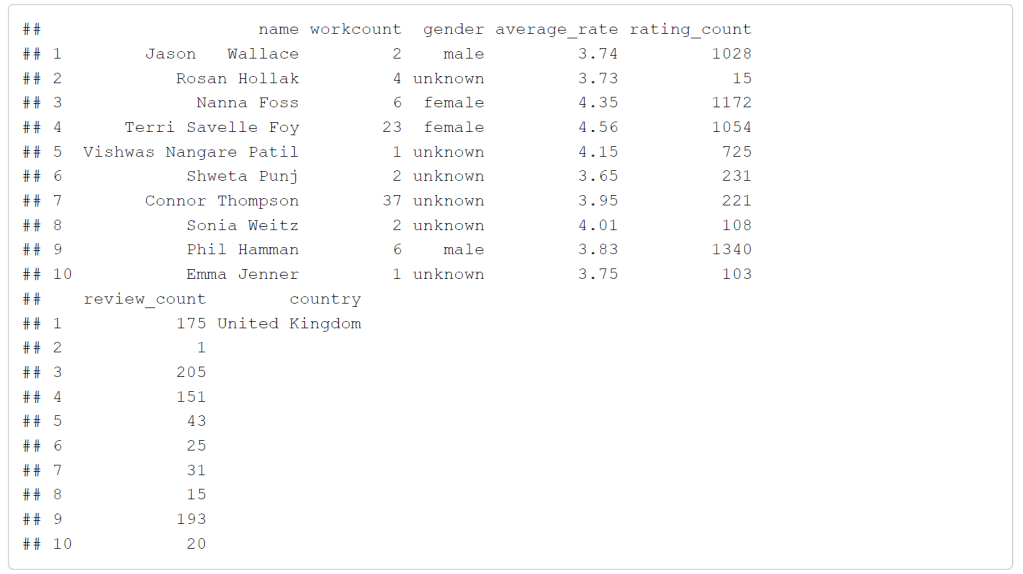
The Goodreads dataset contains over 200,00 authors and various information about each author, although not every row is populated with the column information. The variables I am concerned with for this project are the following:
- average_rate: the average rating of the author ranging from 1 to 5
- rating_count: the number of individual ratings ranging from 1 to 5 for the author
- review_count: the number of individual written reviews for the author
- gender: male, female, or unknown gender of the author
- workcount: the number of unique works published by the author
- country: the country of origin of the author
There are several other columns included in the dataset that I will not be focusing on, such as genre, birth and death years, and other notes about the authors. Here is a preview of the data I will be using:
Some important things to note about these variables are that the rating count increase with every review count, or rather that a rating is required when leaving a written review. Also, I will be focusing on results from just the United States, although many countries are included in the dataset. To illustrate this here is a graph showing the countries with the authors who have the highest number of works:
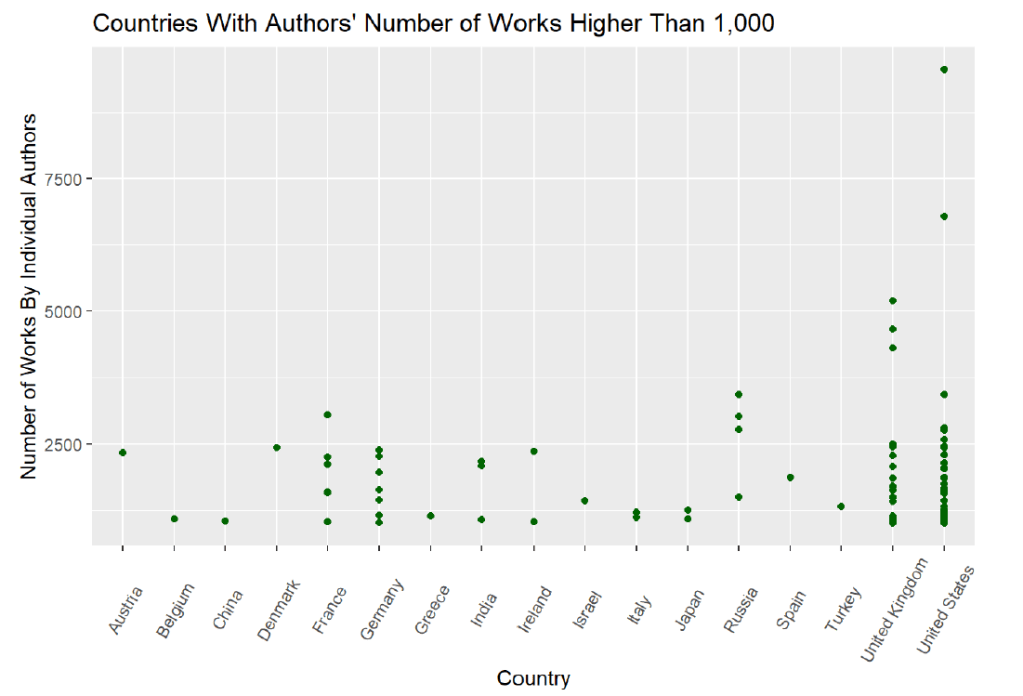
One factor in focusing on just the United States was that it has the most authors with the highest number of published works. During the data cleaning process, I decided to look at who the authors were that had the highest number of published works:
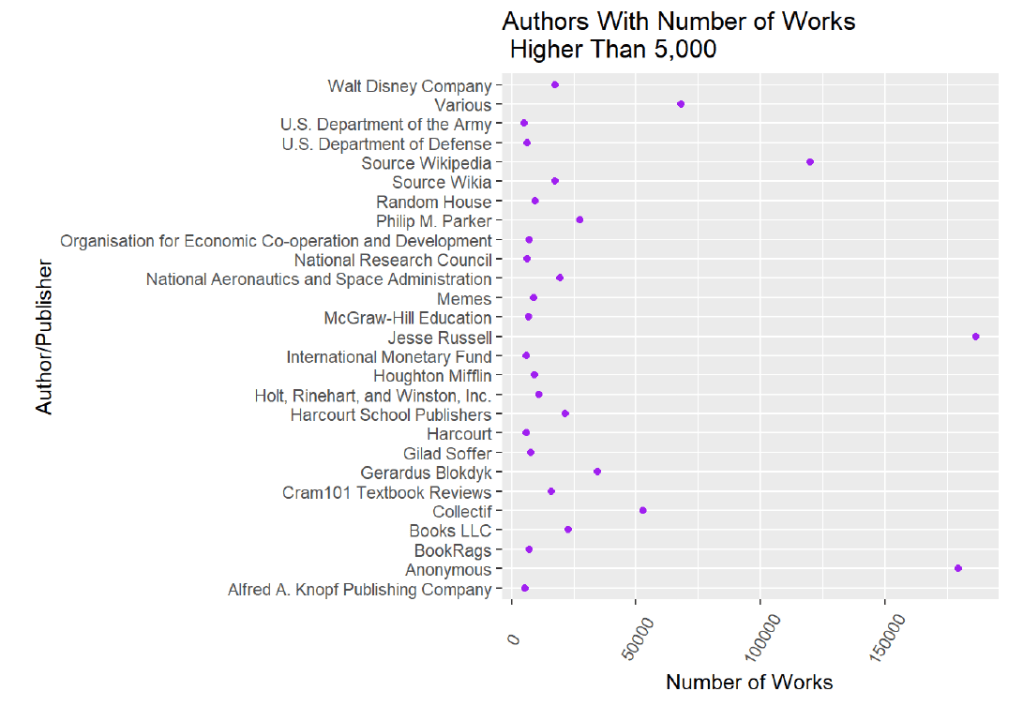
The first thing that stood out from this graph was that the authors with the highest number of published works were not all authors. In fact, most of them were publishers, government entities, or other unrelated categories, such as “Memes”, “Various”, and “Source Wikipedia”. This graph also shows that the highest numbers of published works extend above 50,000 works, which is further evidence that these are not unique published books by an individual author since the average author writes approximately 8 books.
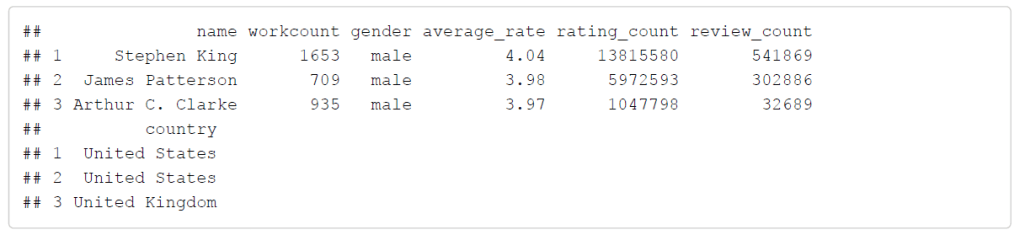
However, I decided to look at the number of works for popular authors who are widely known to have published many novels to find a suitable baseline. I chose to examine the records for Stephen King, James Patterson, and Arthur C. Clarke. As shown below, the number of works for these authors ranges from about 700 to over 1600. Therefore, I limited the number of works from 1 to 1,700 so that I could include well-known authors but hopefully exclude the publishers, government entities, and various non-author subjects.
Another step in trimming the data was to examine gender. The dataset from Goodreads contained 3 categories for gender: female, male, and unknown. The unknown gender is likely due to limitations in the original scripts that collected the data from Goodreads’ API. If the script is not able to identify a gender based on the name of author, then the gender is unknown. Less well-known names or names in a foreign language may have been difficult to identify. I looked at several aspects of gender for this dataset. The first was how many authors in the dataset fall under each gender category:
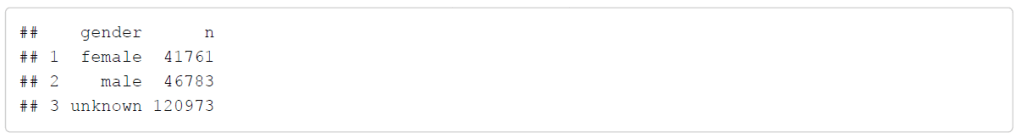
As the table indicates, the number of male and female authors is relatively close, but a large portion of the data contains authors with an unknown gender. Since I want to look at the relationship between gender and the average rating of an author, I needed to remove the unknown gender category. Before doing this, I looked at box plots of the average rating for
each gender category to see if there were any large differences:
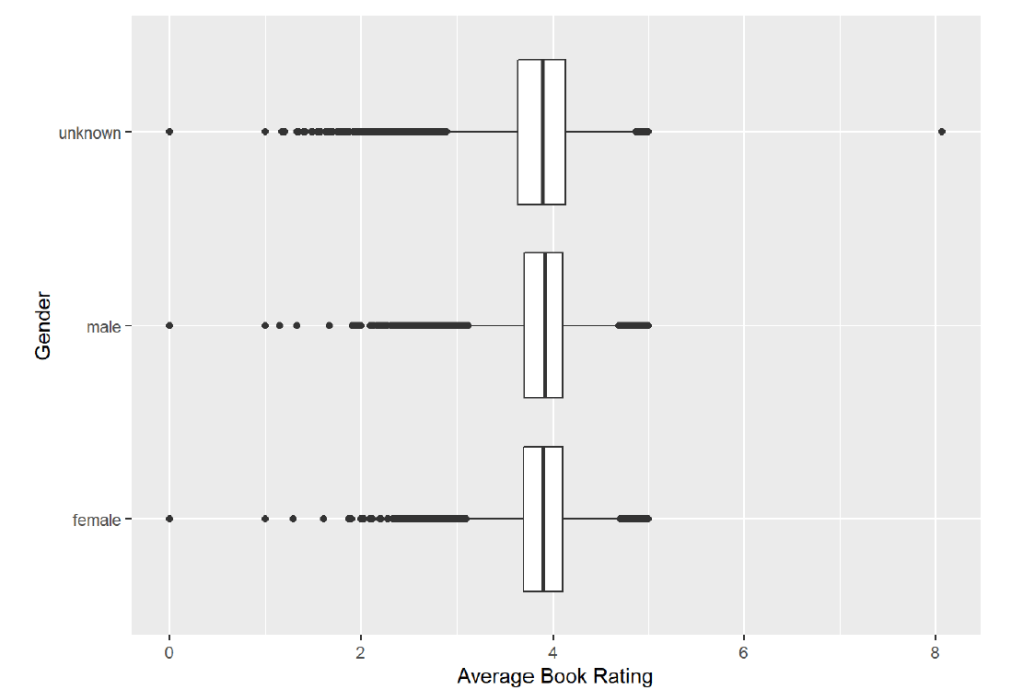
Since I did not see much difference, I went ahead and removed the unknown gender category. After reducing the dataset to just authors from the United States with less than 1700 works, the number of authors for each remaining gender category are shown below:
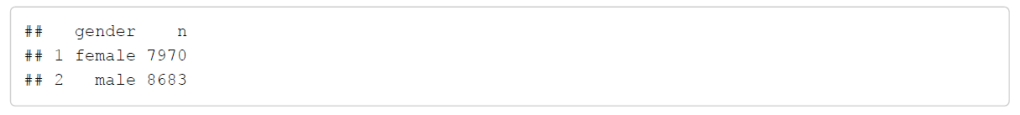
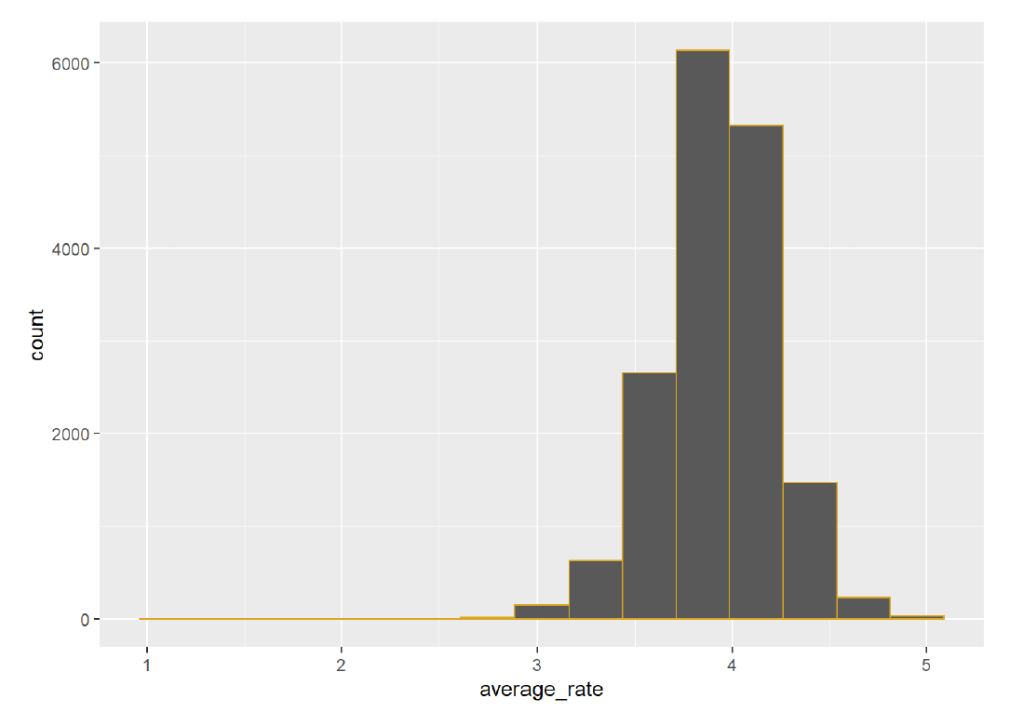
So our dataset has shrunk but still contains valuable information. The number of female authors is about 8,000 while the number of male authors is almost 8,700 which shows that there are more male authors that female in this dataset. Next, I looked at a histogram of the average ratings for the authors and found that the highest frequency was just under 4 (on a scale from 1 to 5):
I was curious about the number of works and the average rating for all authors and for authors split by gender:
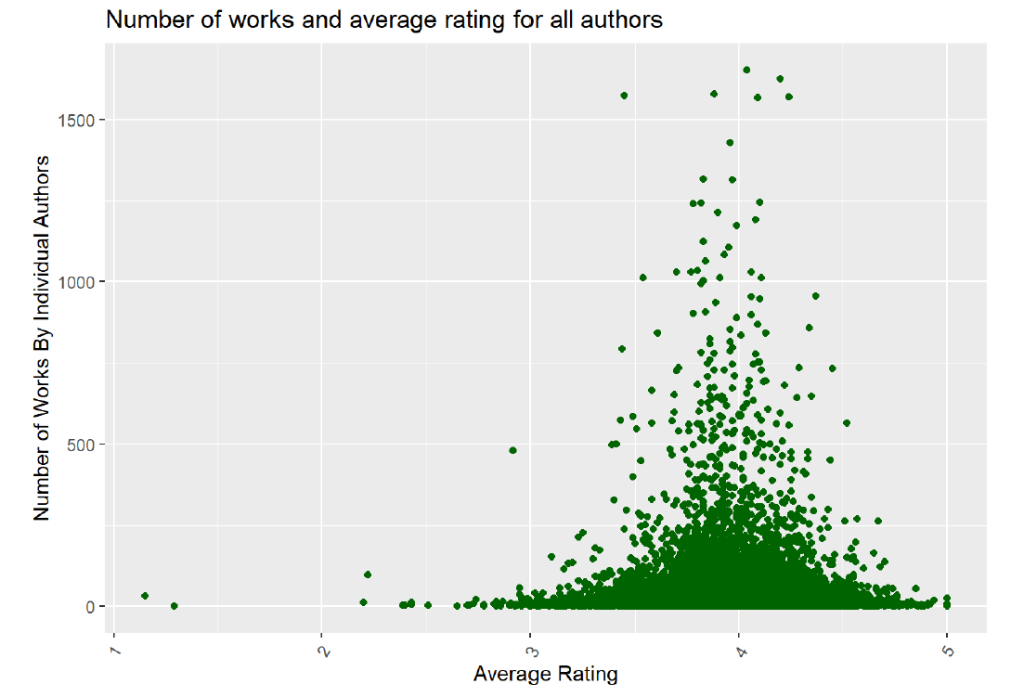
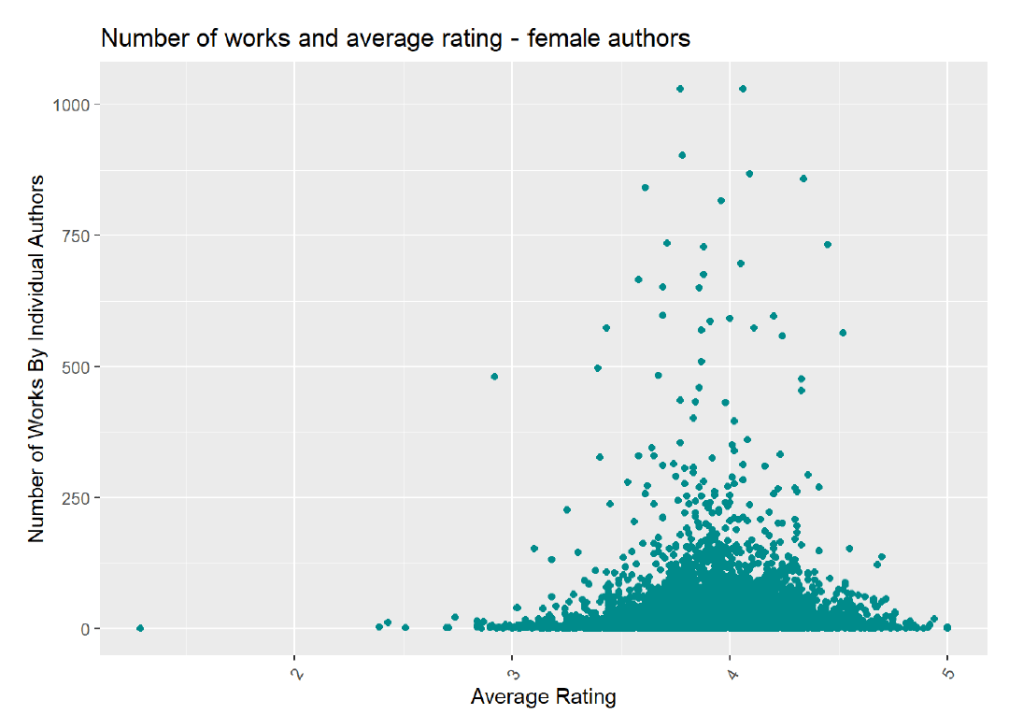
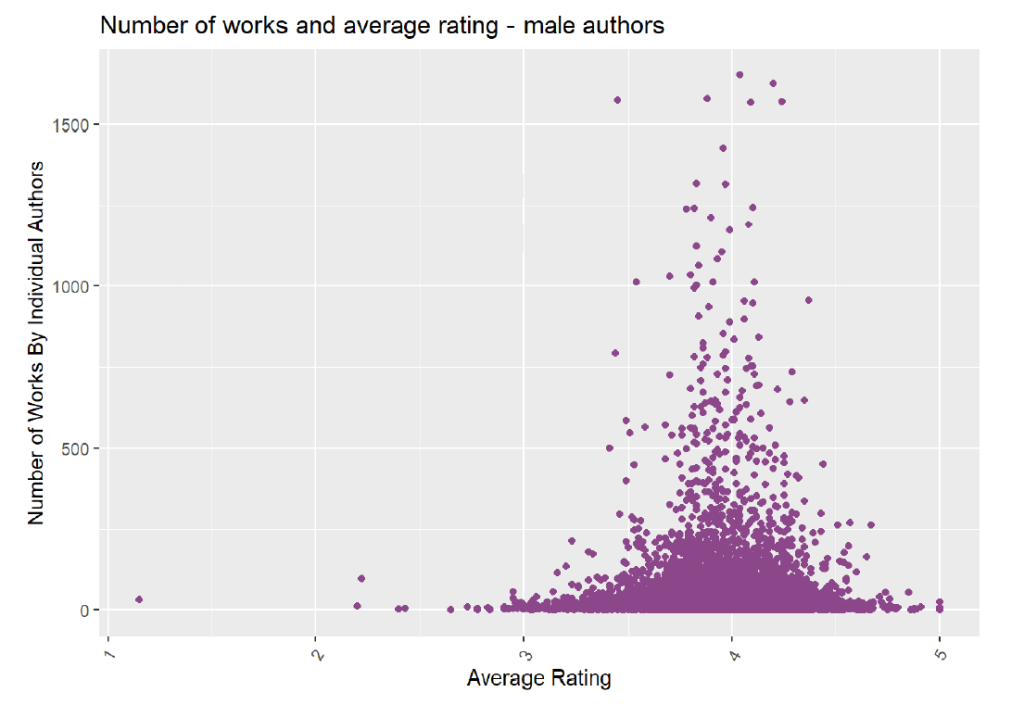
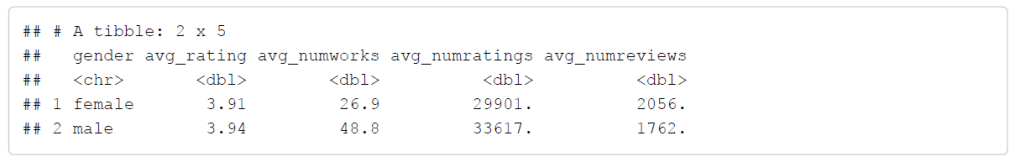
Interestingly, the average rating for female authors is spread out more between 3 to 5, and the number of works appears to be relatively fewer than the number of works by male authors. The average ratings for male authors is also less spread out and instead centers closer to an average rating of 4. The table below summarizes this information and shows that the average rating for male authors is slightly higher than for female authors. Additionally, the average number of works for male authors is about 1.8 times that of female authors. Male authors also receive more ratings, but female authors receive
more written reviews.
Lastly, I removed all data points with any number of works, number of ratings, or number of reviews that equaled 0.
What does the cleaned data reveal?
Once the dataset was cleaned and trimmed to just include information from the United States, number of works less than 1700, and only gender categories of male and female, I examined an overview of the relationships between the response variable (average rating) and the explanatory variables. Since this involves multivariate data, I used a scatter plot matrix:
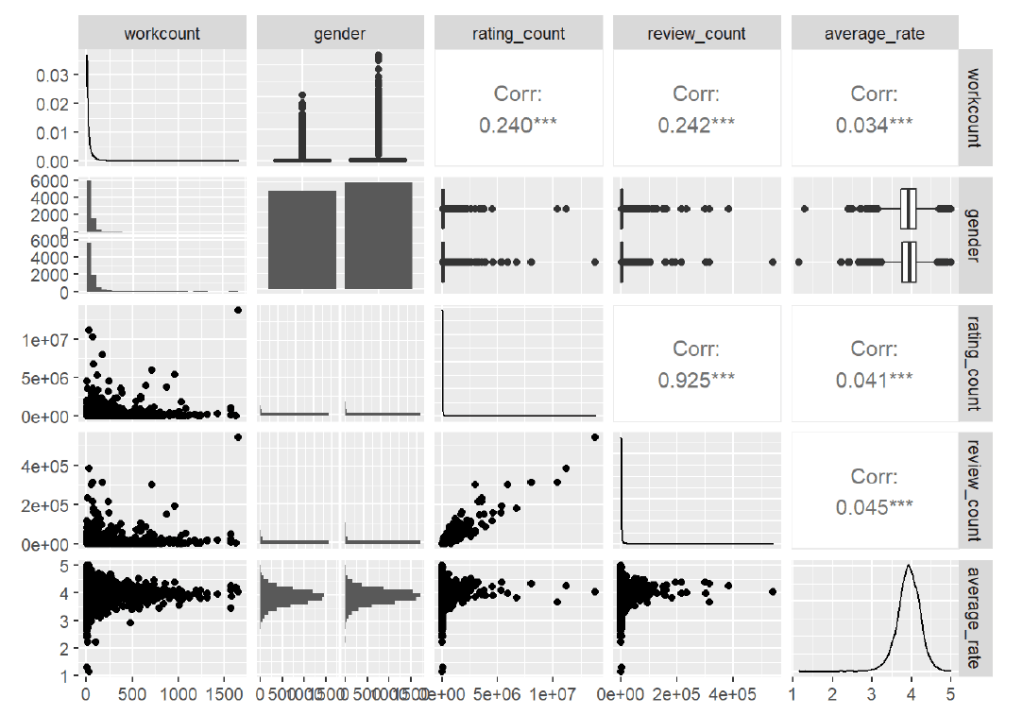
The scatter plot matric shows that there is a strong correlation between the number of ratings and the number of reviews, which can be expected since a rating is required in order to leave a review. The scatter plot matrix also highlights relatively low correlations between the number of works, the number of ratings, and the number of reviews. To further look into this, I
ran a multiple regression to look at the relationships between gender, number of works, number of ratings, number of reviews, and the average rating of the author with the equation being averagerate ∼ gender + workcount + ratingcount + reviewcount. The summary of the regression is shown
below:
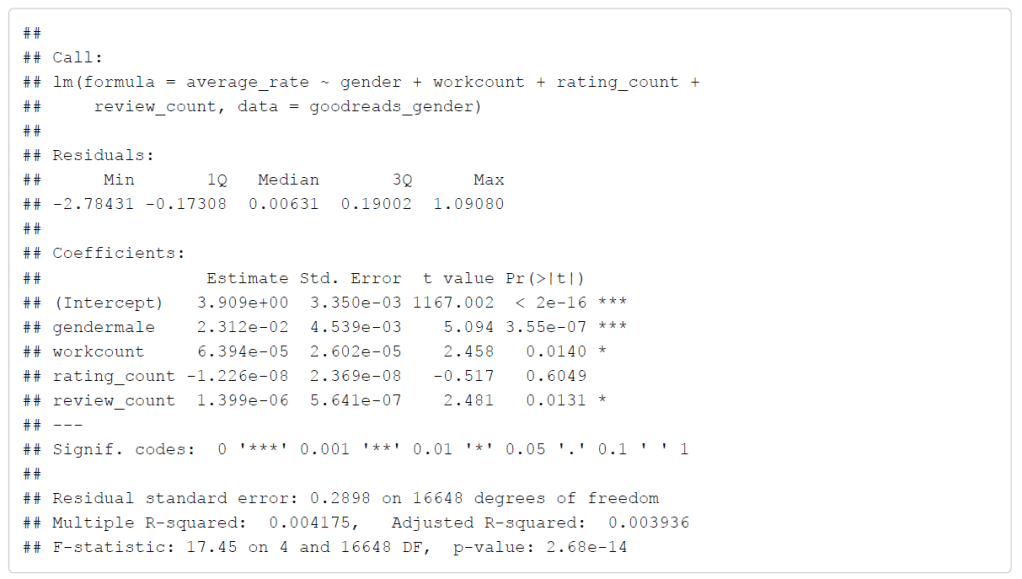
From the regression summary, the average rating for female authors is about 3.9, and the average rating for male authors is slightly higher, as was discovered when examining the number of works vs the average ratings of male and female authors above. Although the difference is small, the gender of the author is the most significant coefficient when influencing the average rating of the author.
The number of works and the number of reviews are slightly significant as well. The positive relationship of average rating with the number of works and number of reviews could be explained since an author with more published books is more likely to be more popular or at least well-known, so a more popular author could be more likely to have high ratings overall.
However, the slightly negative relationship between the average rating and the number of ratings is surprising, especially since the relationship between the average rating and the number of reviews is positive, and the number of ratings and number of reviews are highly correlated. I would expect that more ratings would be tied to a higher average rating for the same reason as why number of works and number of reviews contribute to a higher average rating. I would expect a popular author to have more ratings and for those ratings to have a higher average value. However, this regression shows that is not the case.
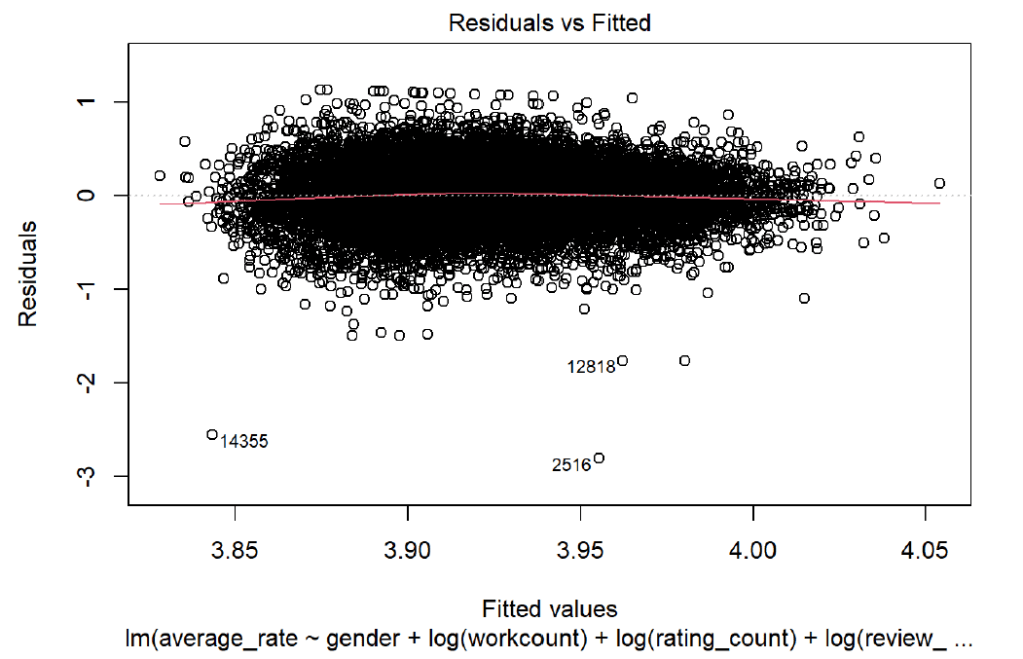
It could be possible that since a popular author would have a higher chance that more people will read the author’s publications, there are more people who could like or dislike the author. This is a possible area for more research, and the negative relationship could also be due to the dataset and the cleaning steps that were taken that eliminated a large chunk of the data. However, the relationship is not significant, so it may just be a limitation of the dataset. To further investigate the validity of the dataset and the regression, I looked at several plots showing information about the residuals. First, I looked at a scatterplot of the residuals vs the fitted, or predicted, values
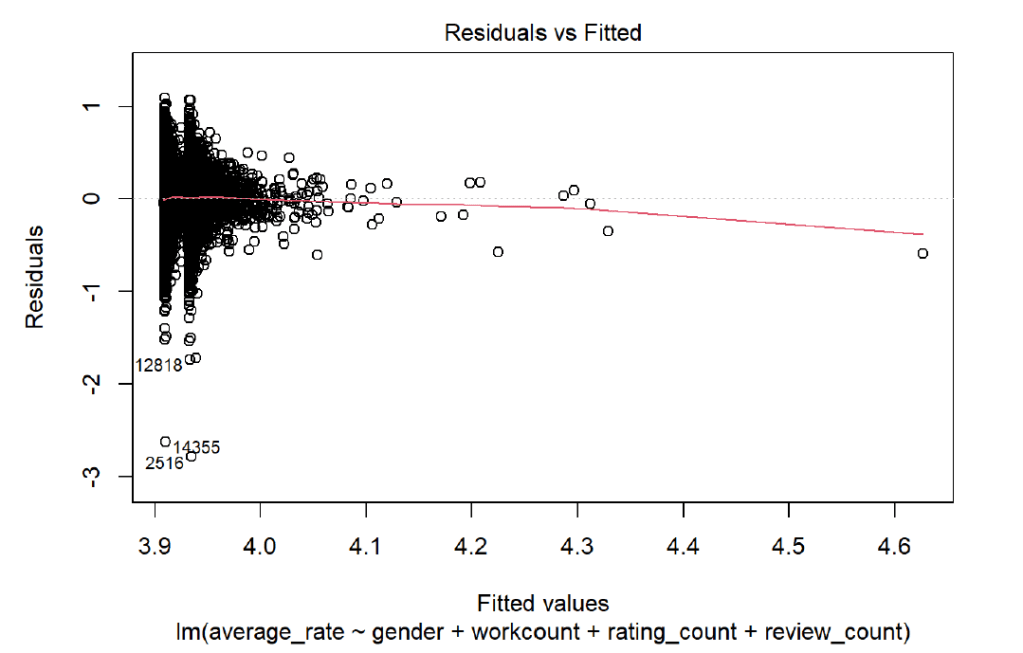
The residuals vs fitted plot immediately shows an odd shape for the residuals. Normally, I would like to see a cigar shape, but instead the residuals fan and have 2 spikes. However, I believe this is due to a limitation within the dataset since the average rating for authors is about 3.9.
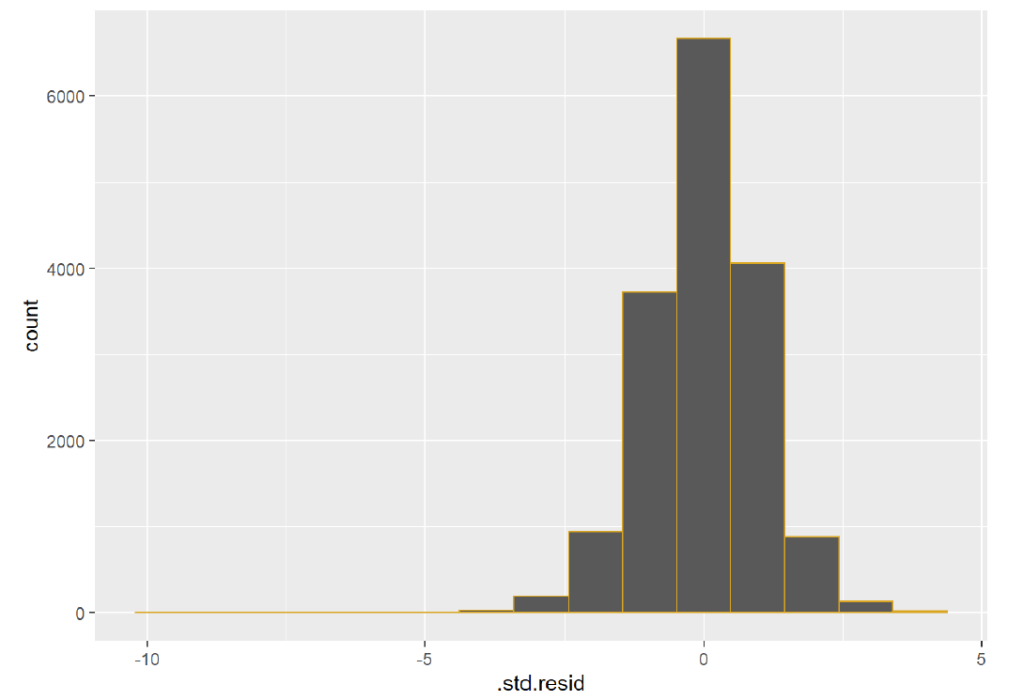
The residuals are linear and don’t seem to show more correlation, which is a good indicator. The x-axis is unbalanced, though, but this does not immediately suggest that the model is incorrect, but it would suggest that the model could be made to be more accurate. To further explore the residuals from the model, I looked at a histogram of the residuals:
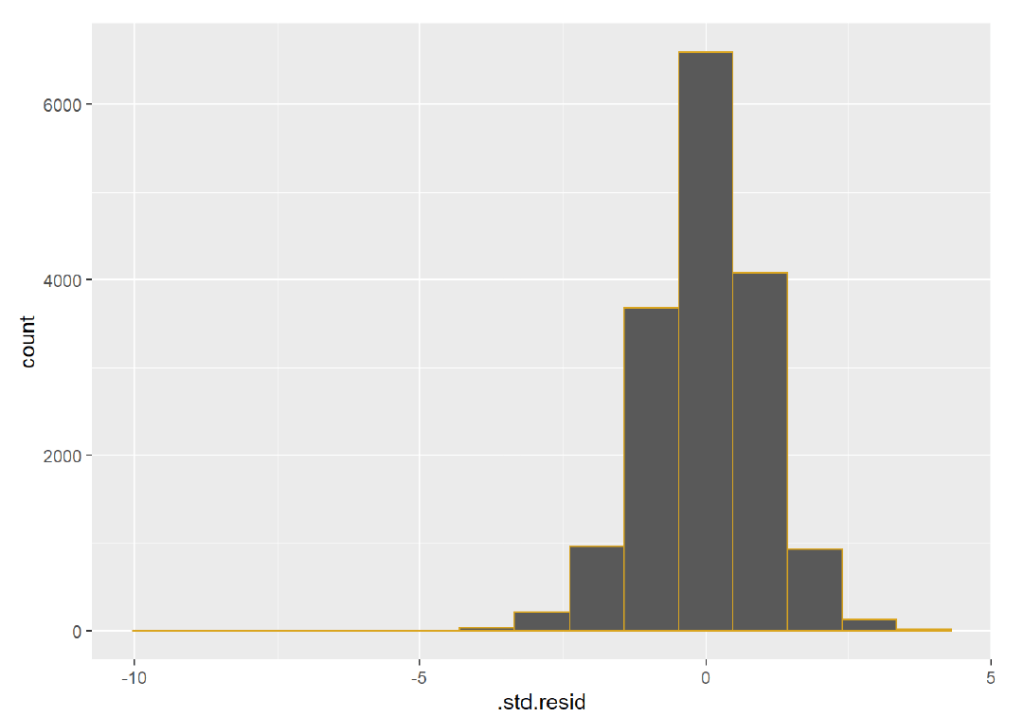
There is a long left tail on the histogram, which could be explained by authors with very low counts of number of works who have a wider range of average ratings. I looked at the top 3 outliers from the residuals vs. fitted values to see if anything stood out about those authors:

All of the top outliers have very low ratings ranging from 1.15 to 2.2, and 2 of the authors were male. The number of works ranges from 1 to 31, the number of reviews ranges from 1 to 336, and the number of ratings covers a spread of 5 to 776, so there is no clear pattern other than the low average ratings.
Based on the plots of the residuals and the regression summary, I would accept the results only on a preliminary basis. Although the significant positive relationship between the average rating and the gender of an author is the expected result, the correlation value is not very high. The overall
multiple R-squared value is 0.004175, which is not the most encouraging.
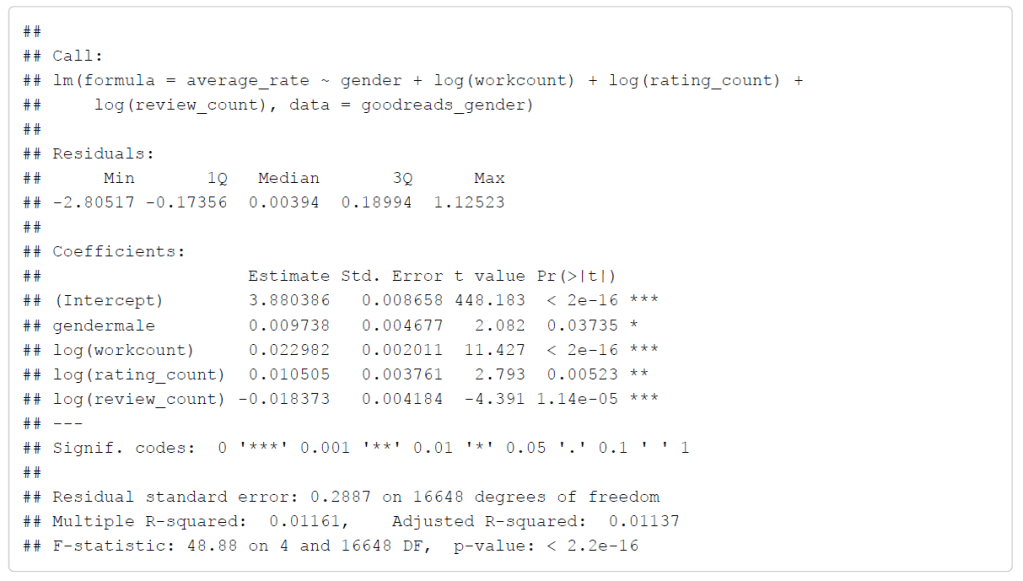
However, the results indicate that further exploration is required. In order to improve the residuals, I used a log transform on all of the explanatory variables except for gender, which gave me a new equation of averagerate ∼ gender + log(workcount) + log(ratingcount) + log(reviewcount). The summary of the regression is shown below:
And here are the plots of the residuals:
As seen from the residuals, log transforming several of the explanatory variables led to significant improvements in the residuals. We now have a more desirable cigar shape that shows linearity, no correlation, low heteroscedacity, and equal variance. The results of the regression also improved. The multiple R-squared is now 0.01161 (vs 0.004175), and all of the explanatory variables show some level of significance.
The biggest change is that now log(review_count) has a negative relationship with average rating. Since this is a linear-log relationship, this indicates that for every 1 unit change in average rating, the percentage of the number of reviews goes down by 1.8%. Before conducting the log transformation, the number of ratings had the negative relationship with the average rating, but now it is the log of the number of reviews that has a negative relationship with average ratings.
Overall, the log transformation indicates weak positive relationships between average rating and gender, the number of works, and the number of ratings, and a weak negative relationship between average ratings and the number of written reviews.
Limitations
A good step moving forward would be to acquire a better data set that can identify gender of a majority of the authors. One major limitation was the vast reduction in data (over half of the data set) due to unknown gender of authors. A better dataset might also provide more complete information. For example, it would have been interesting to see the relationship of average rating with genre of books, but the genre column was not always complete and it included many overlapping categories.
Another limitation of this study was that I focused on just the United States. The dataset contains information about authors from countries all over the world, so a future look into this or using a different dataset should consider look at the global relationships between average rating and gender, number of works, number of ratings, and number of written reviews. I did briefly experiment with this using several top GDP countries (such as the United Kingdom, France, Germany, Russia, India, China), and the results sometimes mimicked the results from the United States. However, I got very different results when I included China in the regression, so I decided to just focus on the United States for the scope of this study.
Finally, there are general problems associated with crowdsourcing data in that much of the information may not be useable. This was evident in the unknown category of gender and missing elements of columns. Goodreads is an excellent source of information, but how that information is collected for a dataset might need to be refined
Um, can I get a summary of that?
Using a large dataset from Goodreads that contains records for authors, I examined the relationships between the average rating of an author and the author’s gender, the number of works, number of ratings, and the number of written reviews. I limited the dataset to include just records for authors from the United States.
Initial exploration of the dataset showed a possible difference in the average ratings for female vs male authors. After running a multiple regression for the average rating and the coefficients, I found that there is a significant relationship between the gender of an author and the author’s average rating.
After looking over the residuals, I decided to log transform several explanatory variables, such as number of works, number of ratings, and number of reviews. After log transforming the data I found that there is a weak positive relationship between the average rating and gender, the number of works, and the number of ratings. There is a weak negative relationship between the average rating and the number of reviews.
Due to limitations with the data, these results should be accepted as preliminary and evidence for future exploration between these relationships before any strong correlations are certified. However, this could be an interesting study, especially using the abundance of information from Goodreads. With a better dataset that includes more usable points, it could be possible to find stronger relationships between an author’s average rating and factors like gender, number of works, number of ratings, and number of reviews.
